

Industries · Property
Portfolio-wide ESG data across developments and managed assets.
Property developers and asset managers report across two very different worlds: construction-phase developments and operating buildings, with landlord–tenant boundaries complicating both.
What makes it hard
Sustainability reporting challenges in property
Development and operations differ completely
Construction-phase data (fuel, materials, waste) and operational data (utilities, refrigerants) need different collection approaches.
Landlord–tenant boundaries
Who accounts for tenant electricity, common areas and chilled water depends on lease structures and boundary decisions.
Portfolio-scale consolidation
Dozens of assets with different managing agents and meters make consistent, complete data collection genuinely hard.
Green certification and investor expectations
Certifications and investor ESG assessments require sustained, evidence-backed performance data, not one-off estimates.
Typical GHG inventory
Common emission sources we help you account for
Source categories typically material in this sector. Your actual inventory is confirmed during scoping.
- Purchased electricity for common areas and landlord services (Scope 2)
- Diesel generators and fire-system testing (Scope 1)
- Refrigerants in chillers and HVAC plant (Scope 1)
- Development-phase construction activities and materials (Scope 3)
- Tenant energy consumption (Scope 3, downstream leased assets)
- Operational waste across managed properties (Scope 3)
Reporting expectations
What regulators and stakeholders expect
Listed developers and REITs report under the Bursa Malaysia Sustainability Reporting Guide, with growing climate-disclosure expectations under Malaysia's adoption of the IFRS Sustainability Disclosure Standards. Clear boundary documentation is critical when portfolios mix owned, managed and tenanted space.
How Scout360 helps
- Asset-level utility tracking with portfolio consolidation
- Boundary and entity configuration reflecting lease structures
- Development and operational sources managed in one system
- Evidence trails that satisfy certifiers, auditors and investors
One view across operations
Site-level data, group-level clarity.
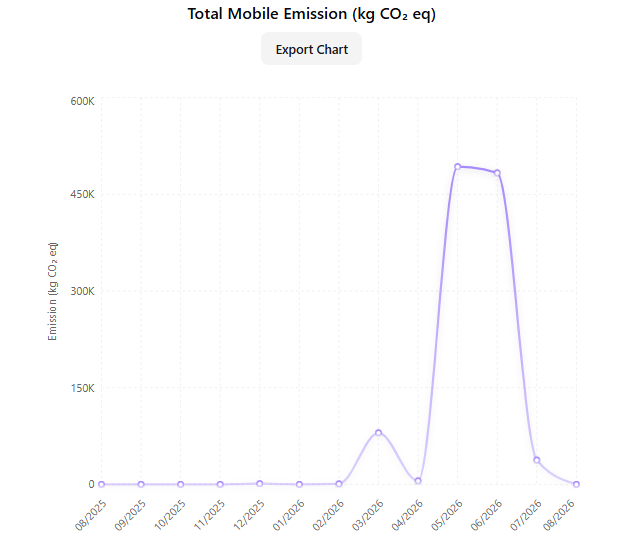
Submissions, emissions and evidence roll up from every site and entity into one controlled repository, so group reporting stops depending on end-of-year spreadsheet archaeology.
Build a stronger reporting system for your property operations.
Book a demonstration configured with examples relevant to your sector.